
As the global workforce becomes more multigenerational, multicultural, and digitally connected, HR leaders need accurate workplace diversity statistics to guide decision-making and policy design. This 2026 guide summarises the latest diversity in business statistics from global and regional sources.

Global Workplace Diversity Statistics at a Glance
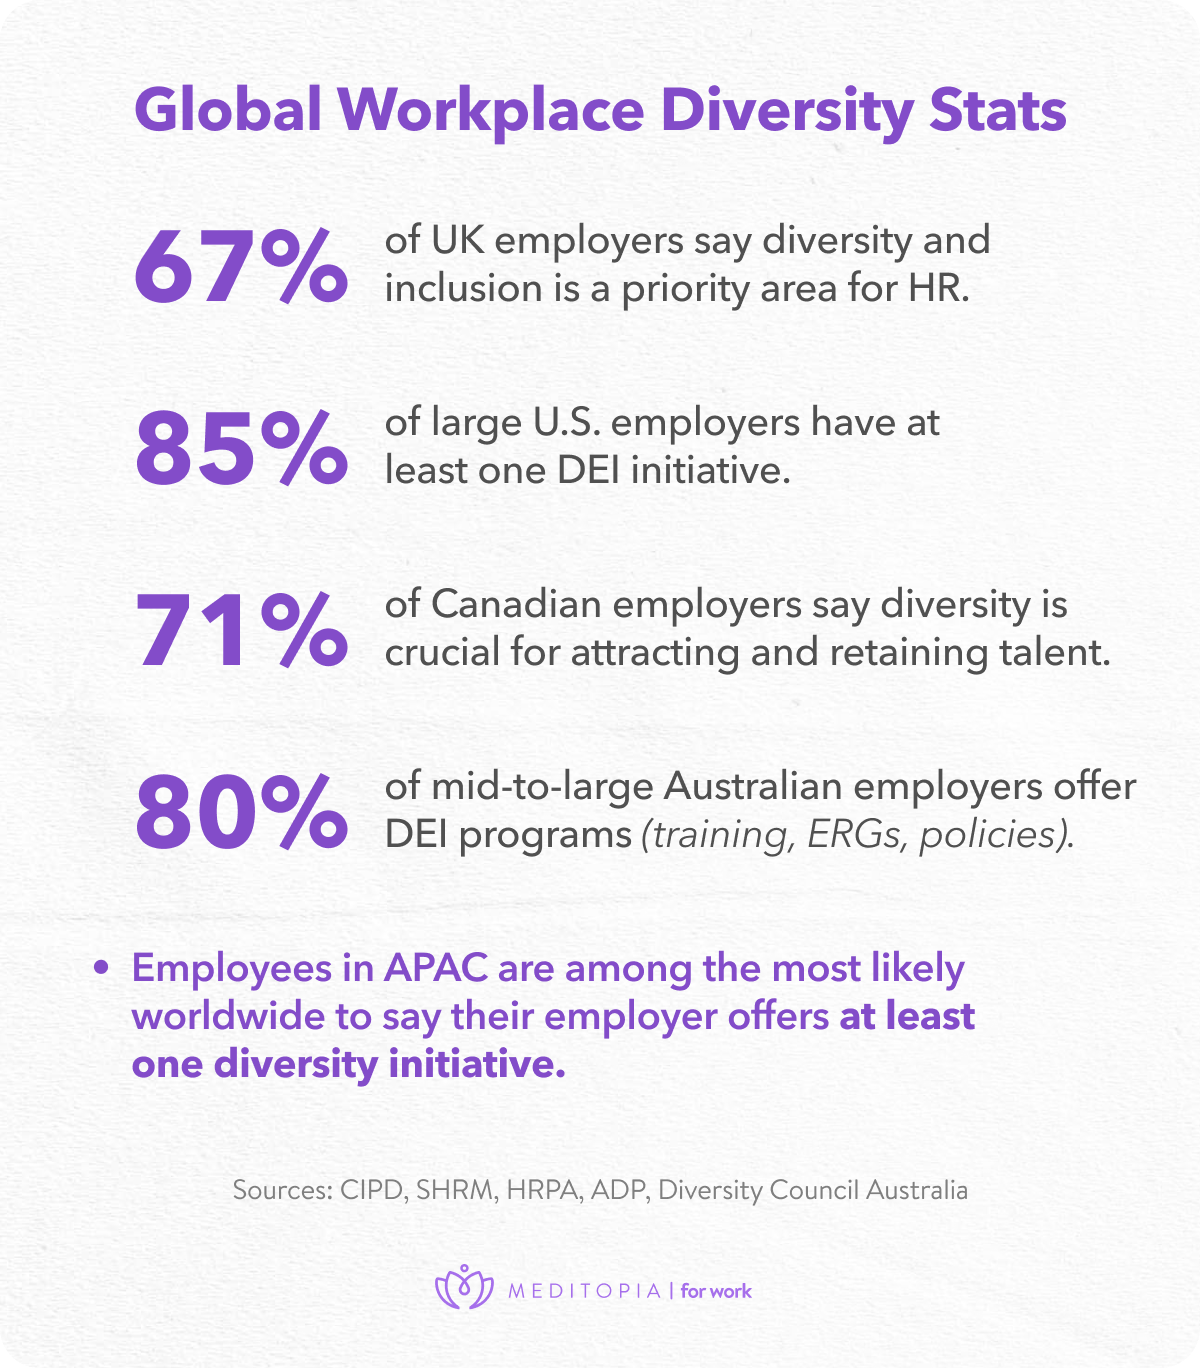
Global workplace diversity statistics highlight steady but uneven progress across gender, ethnicity, age, disability, and LGBTQ+ inclusion. These figures provide a high-level snapshot of where organisations stand as they move into year.
Workplace Diversity Statistics by Region
Regional workplace diversity statistics reveal wide differences in representation, inclusion scores, and DEI maturity. These insights help HR leaders benchmark their own workforce and understand where systemic gaps persist.
UK Workplace Diversity Statistics
The UK continues to advance DEI transparency through mandatory reporting standards. Yet the latest diversity in the workplace statistics UK show persistent representation and pay gaps that organisations must address.
- Gender pay gap remains at 14.3% (median) across all employees [1].
- Ethnicity pay gaps persist, with Pakistani and Bangladeshi employees earning ≈15% less than Caucasian British employees [2].
- Women’s representation on FTSE 350 boards has actually risen to 43.4% (as of early 2025), exceeding the 40% target. While progress continues, women still hold only 7% of CEO roles, and the 50 largest private companies lag behind at 30.5% representation [3].
- Disabled people’s employment gap remains high at 28 percentage points [4].
- Workplace discrimination remains a significant issue, with 38% to 45% of UK employees reporting experiences of unfair treatment or discrimination. Key challenges include a 28% employment gap for certain groups, with 30% of employers indicating limited leadership commitment to diversity.
These gaps influence talent attraction, retention, wellbeing, and team performance metrics. UK employees increasingly expect transparency and real progressrather than symbolic commitments.
Europe Workplace Diversity Statistics
Across Europe, workforce diversity varies widely, with strong gender equality in Northern Europe but slower progress in Southern and Eastern regions. EU-wide inclusion data highlights areas where demographic equity still lags.
- Women in management represent 35% across the EU, but only ~20% in some Eastern European countries [5].
- LGBTQ+ inclusion remains limited: 36% conceal their identity at work due to fear of discrimination [6].
- 21% of workers reported discrimination in the last year based on gender, age, ethnicity, or disability [7].
- Women account for 34% of board members in large publicly listed companies across the EU [8].
- 10% of the EU workforce is foreign-born, creating both cultural diversity and inclusion challenges [9]. This is one of the reasons why Meditopia for Work offers self-guided content in 14 languages.
European organisations need to balance representation with inclusion strategies, especially around psychological safety, equitable promotion pathways, and multicultural team dynamics.
Canada & US Workplace Diversity Statistics
North America has among the most robust reporting frameworks on diversity in business statistics, revealing clear disparities in leadership, pay, and workplace inclusion.
- Only 8.8% of Fortune 500 CEOs are women as of 2024 in the US [10].
- Racial representation in the US is still low [11]:
- Black executives account for 5% of senior leadership roles.
- Latino executives account for 5.5%.
- 44% of US employees say discrimination is still a significant workplace problem.
- Only 1 in 4 senior management roles in Canada are held by women [12].
- Among companies publicly reporting board data, racialized directors hold 15% of seats, while Indigenous directors hold <1% [13].
- Immigrant talent represents 26% of Canada’s workforce, significantly influencing workplace demographics.
North American and Canadian DEI strategies require structural change to close gaps in leadership, pay equity, and inclusion outcomes.
Asia & Australia Workplace Diversity Statistics
Asia-Pacific diversity trends are complex, shaped by cultural norms, economic development, and evolving legislation. Australia, however, stands out as one of the most transparent regions for gender and leadership reporting.
- Women in Japan hold 15% of management positions, among the lowest in OECD countries [14].
- 53% of Japanese employees report high workplace stress, linked to lack of autonomy and rigid hierarchies [15].
- A national cross-sectional study in China found that 38% of general practitioners report workplace discrimination, affecting retention and psychological safety [16].
- Women account for only 17% of senior leadership roles in major Chinese firms [17].
- In India, women’s labour force participation is 33%, with major regional variation [18].
- Average organisational gender pay gap in Australia is 21.7% [19].
- Women represent 32% of key management positions in Australia, and psychological health risks have increased by 30% in workplaces with low role clarity and poor inclusion.
How Employee Wellness Programs Influence Workplace Diversity
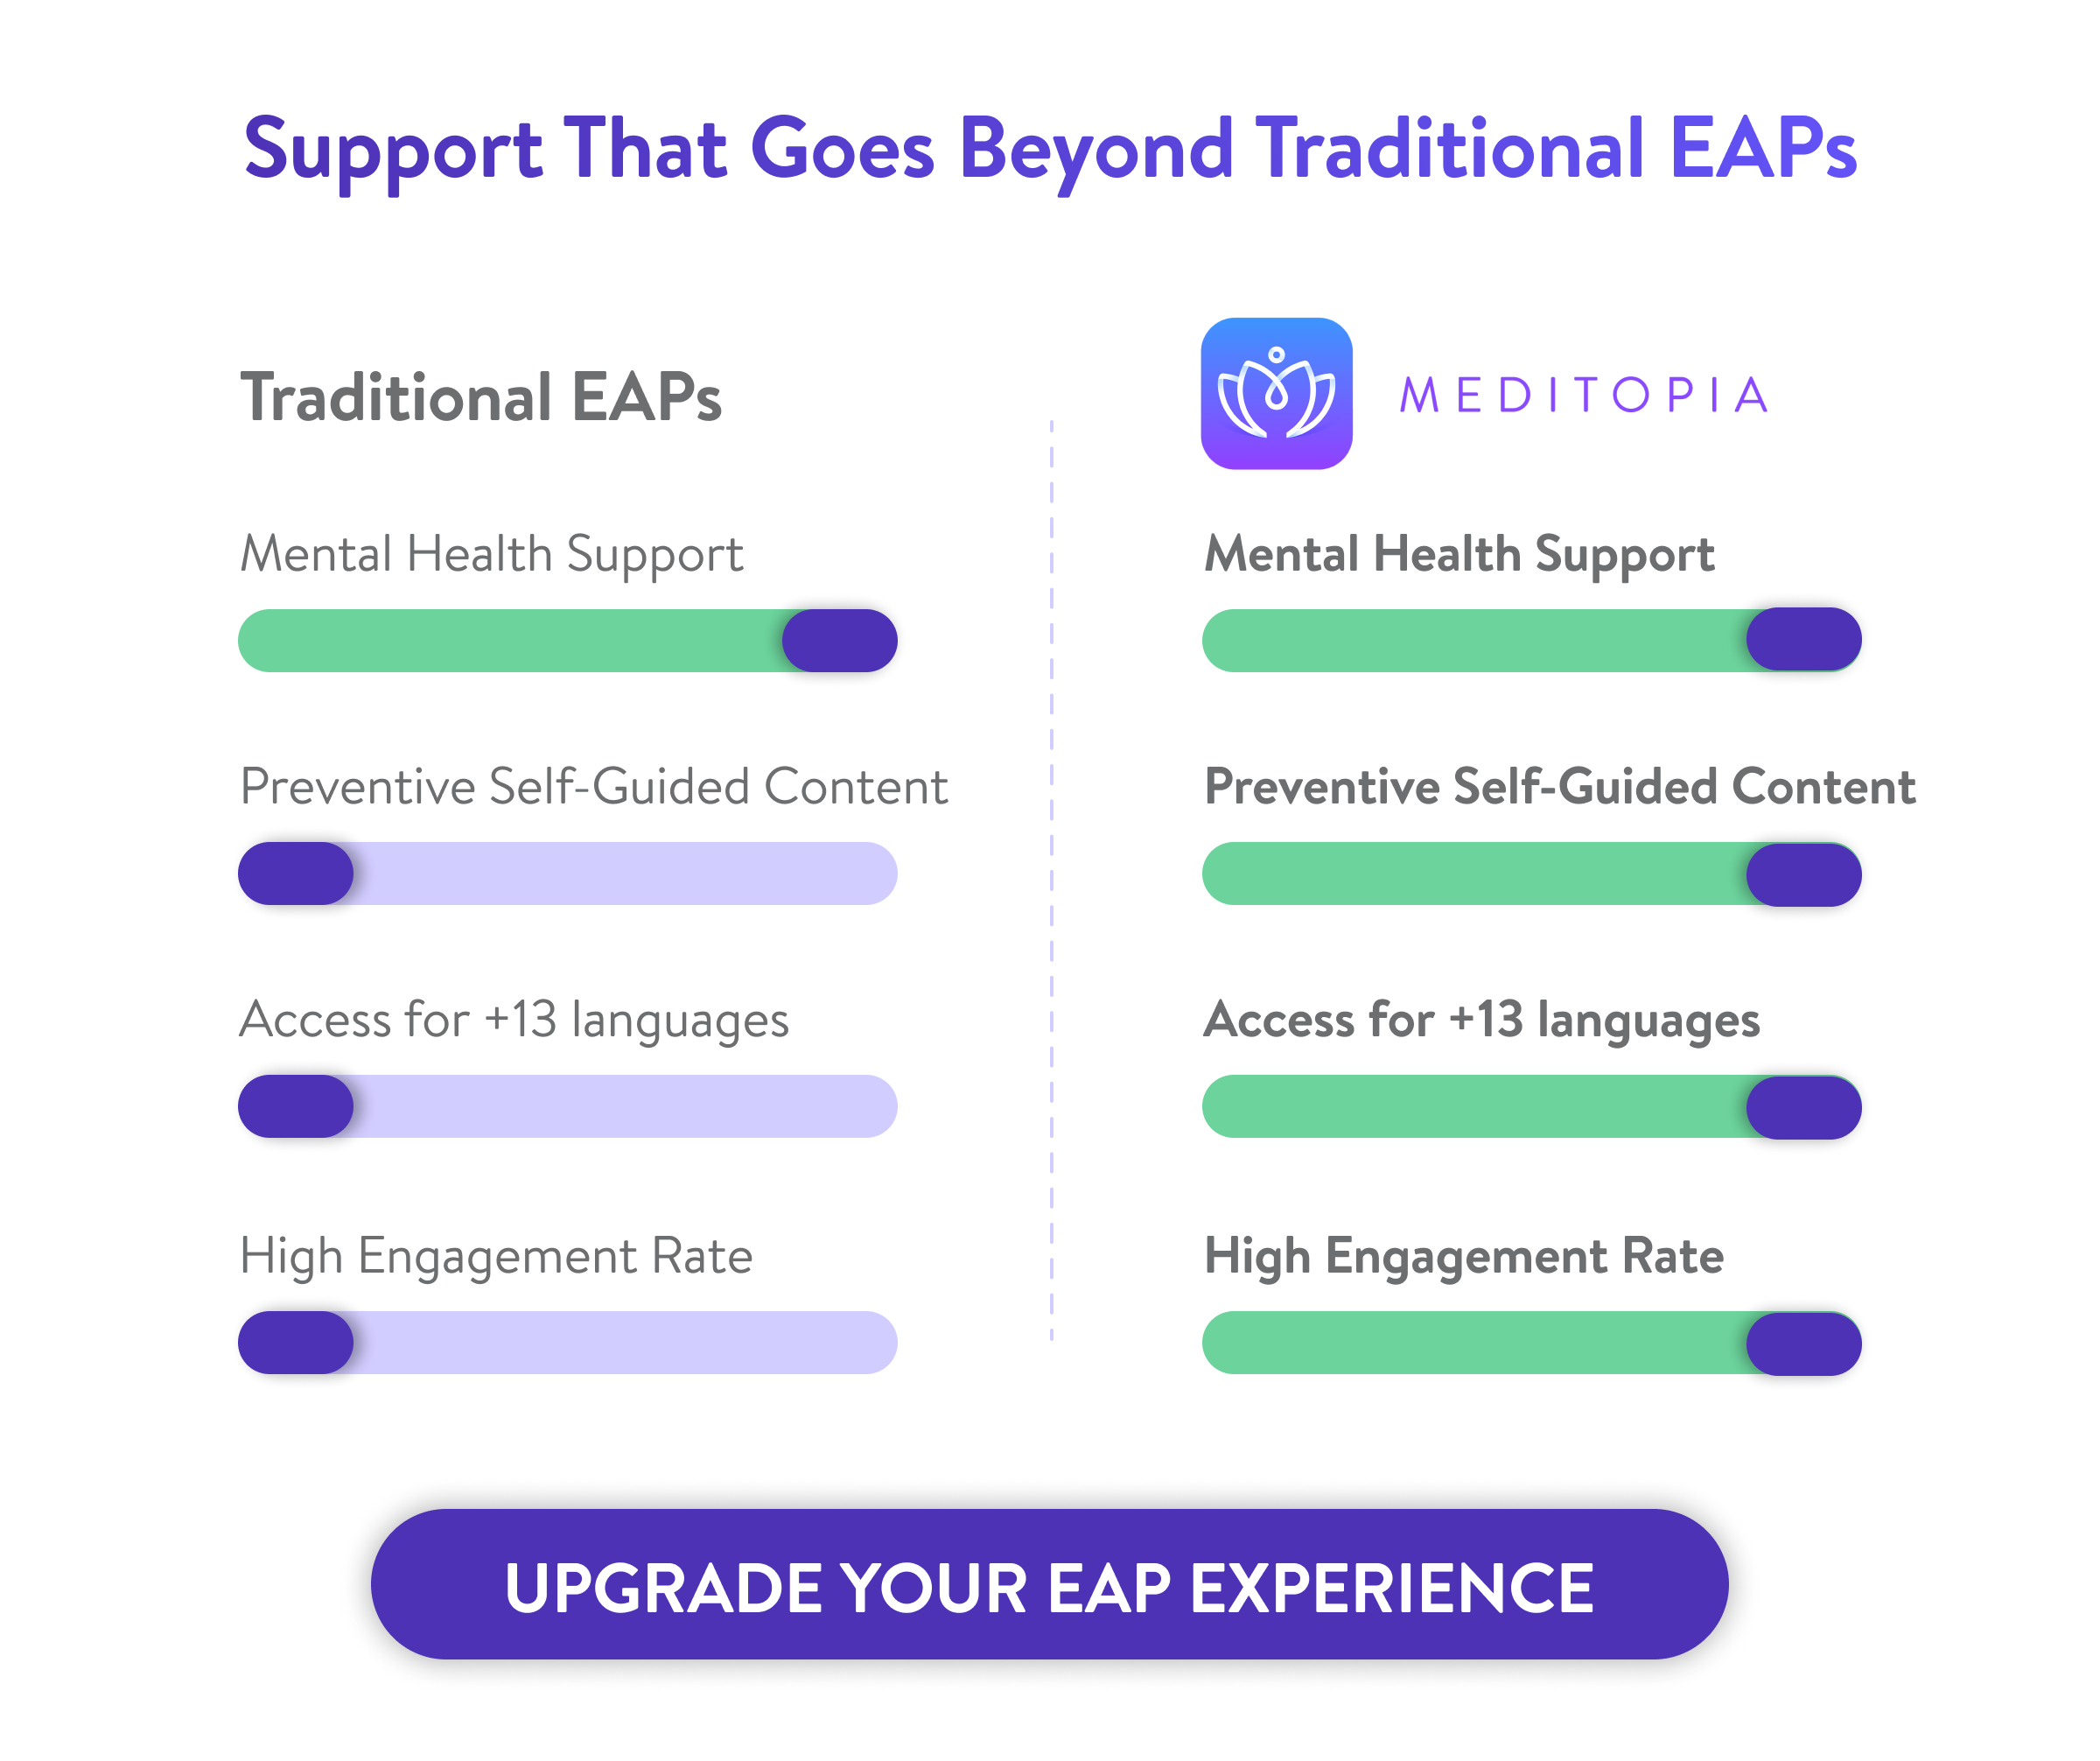
Effective employee wellness programs like Meditopia play a pivotal role in improving inclusion scores, equitable access, representation, psychological safety, and retention. Research shows that wellbeing and diversity outcomes are deeply interconnected.
If you're interested in EAP utilization rates, you can discover updated stats and more in our specialized blog.